Network of the Day
Network of the Day
Live demo of NoD can be accessed from here
Daily Network Visualization
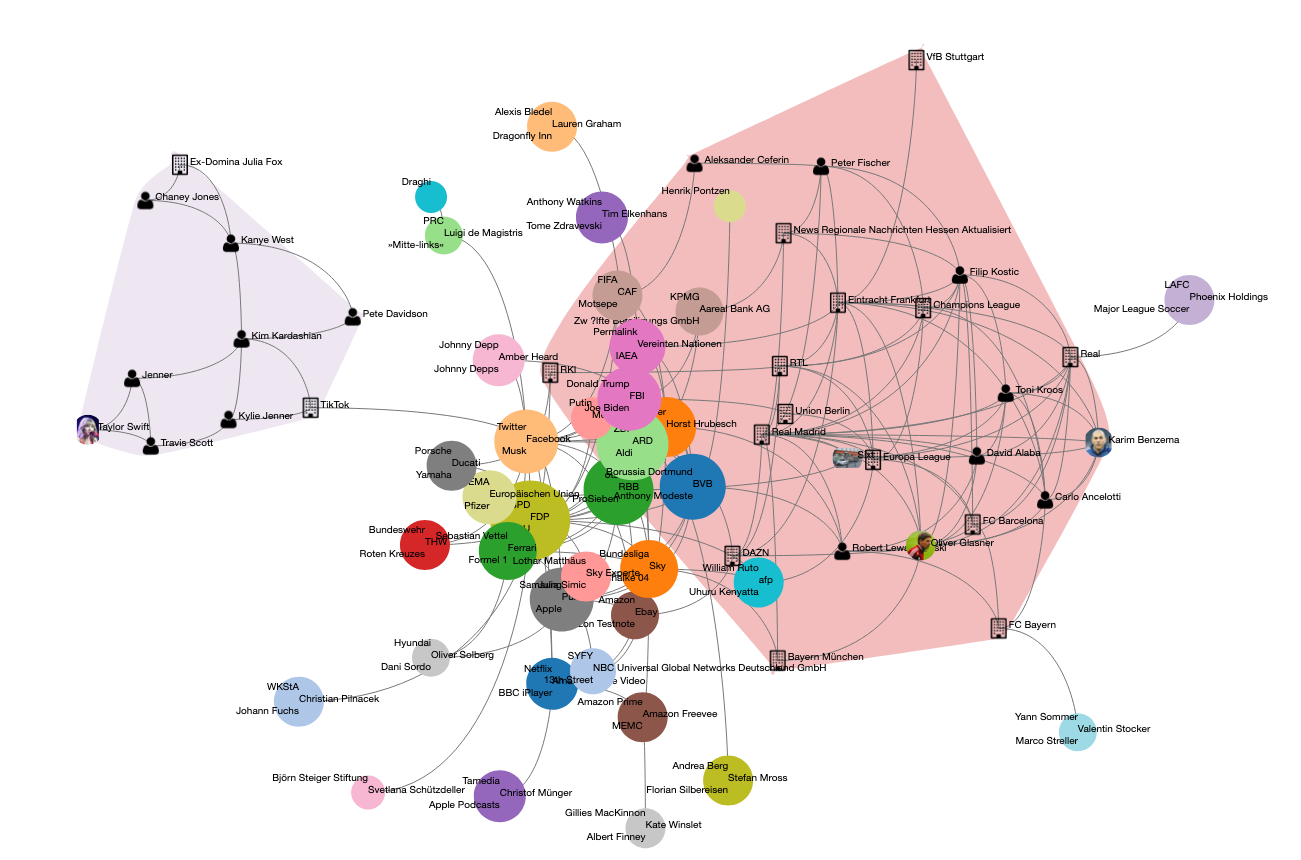
The following diagram shows the main visualization components of NoD. The source code and documentation of NoD will be publicly available soon and is available per request.
- Interactive time-dependent network:
- Clusters: Organized by topic
- Nodes: Named-Entities (persons and organizations)
- Edges: Relations between Named-Entities
- Frequency-Chart:
- Shows terms that were popular on
the respective day - Trend of terms can be observed over time
- Shorter
timespans can be selected - Two peaks reflect changes in Schumacher‘s condition
- Shows terms that were popular on
- Cooperative social tagging:
- Source sentences linked to original online articles
- Users may add a tag which labels the relationship
- Entity Search:
- Search mask allows users to search for entities
- Match will open the respective cluster
- Datepicker:
- Select date of interest